Radiosonde Data for Pilots: The Preflight Tool You're Probably Ignoring
Most pilots have heard of radiosondes. Few actually use them. That’s unfortunate, because radiosonde data is one of the most useful weather resources available to GA pilots. It’s free, it’s updated twice daily, and it tells you things your METARs and PIREPs simply can’t.
What Is a Radiosonde, Exactly?
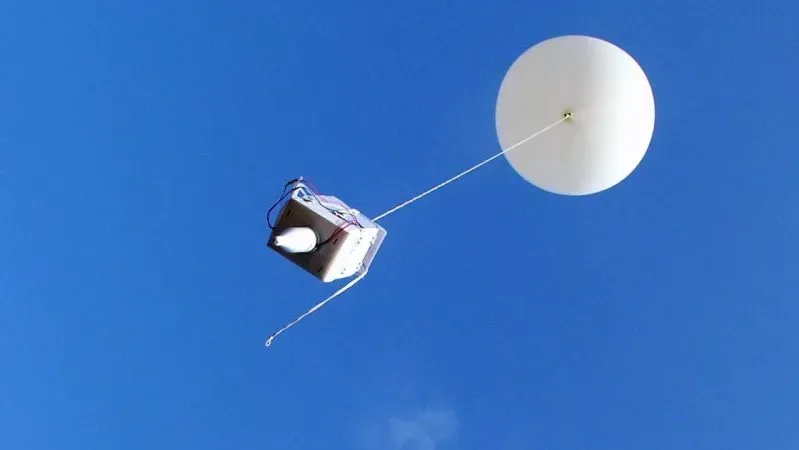
A radiosonde is a small instrument package attached to a weather balloon, launched by the National Weather Service from roughly 90 stations across the United States, twice a day, every day, at 0000Z and 1200Z. As the balloon ascends from the surface to altitudes above 100,000 feet, the radiosonde measures and transmits temperature, dewpoint, pressure, wind speed, and wind direction at hundreds of data points along the way.
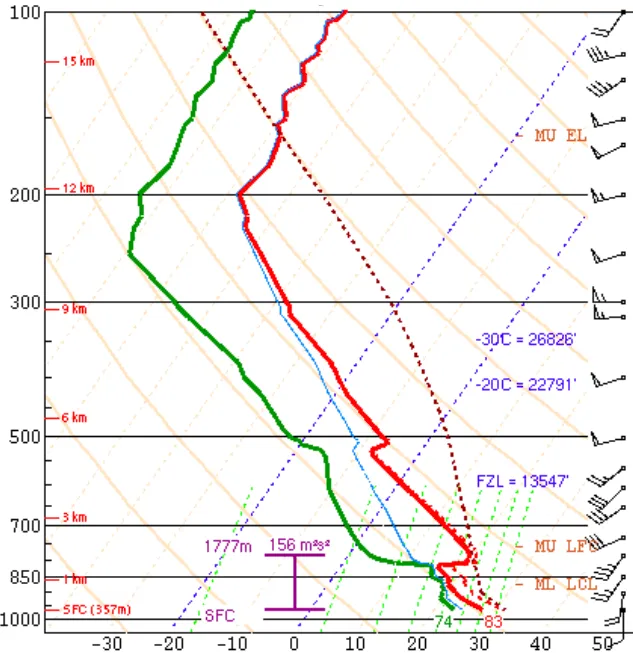
The result is a vertical atmospheric profile, a snapshot of the entire column of air above a given location, captured in real time and plotted on a chart called a Skew-T Log-P diagram (Skew-T for short).
Why Most Pilots Don’t Use It
The Skew-T has a reputation for being dense and difficult to interpret. Pilots see a graph full of diagonal lines, curved traces, and cryptic labels and quickly decide it wasn’t designed for them.
They’re half right. Skew-T diagrams were developed primarily for meteorologists, and the full interpretation can get complex. But you don’t need to be a met to get real value from radiosonde data. A working knowledge of a few key elements gives you information that standard preflight briefing products simply don’t provide.
I get it — Skew-Ts look intimidating. They still do to me a little. But understanding a METAR takes longer than learning the two or three parts of a sounding that matter for most GA flying. Half an hour of focused effort and you have the basics.
What Radiosonde Data Tells You That Nothing Else Does
1. Actual Freezing Level, Not a Forecast
Your weather briefing will give you a forecast freezing level. The radiosonde gives you the measured freezing level: where 0°C actually was in the atmosphere at launch time, confirmed by instrumentation.
Forecast freezing levels can be off by thousands of feet, especially in dynamically changing air masses. I’ve made the mistake of looking only at freezing level forecasts and not checking the actual sounding. More than once the atmosphere wasn’t behaving quite the way the forecast products suggested. When I’m planning a Baron trip from San Martin to Truckee in winter, one of the first things I want to know is where the freezing level sits relative to the MEAs and expected cloud layers. Knowing where 0°C actually was at 1200Z this morning is a far more reliable data point than the model output that populated my briefing.
2. Temperature-Dewpoint Spread at Altitude
On the ground, you use temperature-dewpoint spread to estimate cloud base. Aloft, it works the same way, and the Skew-T gives it to you at every level.
Tight spread (2-3°C or less) at a given altitude means near-saturated air: clouds, potential icing, and reduced visibility. The first time I really started to recognize the value of the Skew-T was with IFR and mountain flying. When the temperature and dewpoint traces start converging closely, I know I’m going to find visible moisture. That right there is worth its weight in gold when you’re trying to avoid ice. You’re not guessing based on a forecast — you’re looking at what the atmosphere is actually doing.
3. Atmospheric Stability and Convective Potential
The temperature trace shows you atmospheric stability at a glance. A steep lapse rate means unstable air: convective potential, turbulence, rough rides even without thunderstorms. A temperature inversion — where temperature increases with altitude — means stable, capped air. That cap can suppress convection, but it can also trap haze, smoke, and pollution under it, dramatically reducing visibility.
Temperature inversions are worth paying attention to for another reason: they’re a strong clue that non-convective low level wind shear may be present. That’s the kind of hazard that won’t show up in a TAF or METAR, but it’s right there on the sounding if you know what to look for.
If you fly anywhere prone to afternoon convection, the morning sounding can tell you whether the atmosphere is loaded for thunderstorms — often hours before anything shows up on radar.
| Index | What It Measures | What to Watch For |
|---|---|---|
| CAPE | Convective Available Potential Energy — fuel for thunderstorm updrafts | >1,000 J/kg = meaningful convective potential |
| LI | Lifted Index — atmospheric instability | Negative values = unstable; more negative = worse |
| CIN | Convective Inhibition — the cap holding convection down | High CIN + high CAPE = “loaded gun” for explosive development |
Most radiosonde products calculate and display these indices for you. You don’t need to derive them manually.
4. Wind at Every Level
PIREPs give you winds at specific altitudes from pilots who’ve already been there. The radiosonde gives you a continuous wind profile from the surface up — where the wind is light, where it’s screaming, where shear exists between layers, and how the direction rotates with altitude.
This is especially useful for mountain flying. The wind profile aloft drives a lot of what the terrain does to the air at your altitude, and seeing the whole column at once makes it easier to pick an altitude that works for you rather than against you.
5. Turbulence Potential Through Wind Shear
Turbulence is hard to forecast precisely, but the radiosonde gives you something concrete: measured wind shear between layers. Large changes in wind speed or direction over a small altitude range point to mechanical turbulence. Pair that with the lapse rate and you can get a reasonable sense of where the rough air is before anyone files a PIREP.
How to Access and Read Radiosonde Data
Several tools make this accessible without requiring a meteorology degree:
University of Wyoming Radiosonde Archive: The classic. Go to weather.uwyo.edu, select your region and station, and pull the current or archive sounding. You’ll get the Skew-T diagram along with a data table and computed indices. It’s not pretty, but it’s comprehensive and trusted.
Windy.com (Sounding tab): Windy generates a clean, readable Skew-T for any point on the map using recent radiosonde data and model output. Much easier on the eyes than the Wyoming site.
SPC Soundings (Storm Prediction Center): spc.noaa.gov/exper/soundings provides observed soundings across the U.S. with calculated instability indices. Designed for severe weather forecasting but highly useful for any pilot who wants real data.
Skew-T Explainers: The NWS and several flight training organizations have produced straightforward guides to reading Skew-T diagrams. Thirty to sixty minutes with one of these and you’ll have enough to start using soundings in your briefings.
Putting It Into Practice
You don’t need to make the Skew-T your primary briefing source. It’s more useful as the thing you check when you want to understand why your briefing says what it says.
Say your METAR shows IFR conditions. The Skew-T tells you whether there’s an inversion keeping it stuck at the surface, or whether the freezing level sits just a few hundred feet above your departure airport. If your TAF forecasts afternoon MVFR, the morning sounding tells you whether the atmosphere has the instability to turn those clouds into something worse.
For mountain routes, the value is even more direct. The sounding shows you where the wind goes from a manageable headwind at 8,000 feet to a 60-knot firehose at 12,000 — and the moisture profile tells you where cloud tops actually are, which is often thousands of feet off from what you’d expect looking at a TAF or area forecast alone.
None of this replaces your standard briefing, but it gives you a much better feel for what you’re flying into. It’s the same idea behind why even “easy” VFR flights deserve a thorough preflight brief — better preparation leads to better decisions.
The Bottom Line
When you know why the conditions are what they are, you can anticipate how they’ll change, recognize when your briefing is going stale, and make go/no-go calls you actually feel confident about.
The data is free. The balloons go up twice a day. It takes maybe an hour to learn the parts that matter. That’s a pretty good return on investment for the rest of your flying career.
Have questions about interpreting radiosonde data or want to walk through a sounding together during a flight lesson? Reach out. It’s the kind of preflight work that makes every subsequent flight more informed.
Frequently Asked Questions About Radiosonde Data for Pilots
What is a radiosonde?
It’s a small instrument package that rides a weather balloon up through the atmosphere, measuring temperature, dewpoint, pressure, wind speed, and wind direction the whole way. The data comes back in real time and gives you a vertical profile of the air column above that station.
How do pilots read a Skew-T diagram?
You don’t need to understand every line on the chart. Focus on three things: where the temperature and dewpoint traces converge (that’s where you’ll find clouds and moisture), where the temperature trace shows inversions or steep lapse rates (stability and turbulence clues), and the wind barbs along the right side (wind speed and direction at each altitude). That covers most of what matters for GA flying.
Where can I find free radiosonde data?
The University of Wyoming Radiosonde Archive is the classic source — not pretty, but solid. Windy.com’s Sounding tab is much cleaner visually. The Storm Prediction Center is great if you want instability indices calculated for you. All three are free.
How often is radiosonde data updated?
Twice a day — the NWS launches from about 90 stations across the U.S. at 0000Z and 1200Z. Some stations put up extra soundings during significant weather events.
Can radiosonde data replace a standard weather briefing?
No. It’s a supplement. Soundings help you understand why conditions are what they are, but you still need your METARs, TAFs, AIRMETs, and PIREPs for the full picture.
David Stites, MEI
Multi-engine flight instructor and professional ferry pilot in the San Francisco Bay Area.
Ready to Start Your Multi-Engine Training?
Contact me today to discuss your training goals and schedule your first lesson.
Get in Touch